To help us students thrive in the rapidly-changing world around us, NUS has recently introduced a new General Education (GE) curriculum for all freshmen, beginning AY21/22.
This GE reform aims to integrate knowledge from different fields into our education, to equip us with relevant skills from outside our disciplines.

This new curriculum features 6 pillars in total, each with its unique focus. As a student of NUS, you are required to do all 6 of these & no exemptions will be granted, whether you are from JC or polytechnic.
As you can see from the above image, one pillar encompasses “Data Literacy” and this is tied to the module – GEA1000.
Here’s what you need to know about this module:
Contents
What is GEA1000?
GEA1000 is also known as Quantitative Reasoning With Data and it is a new module introduced due to the new GE curriculum for all NUS freshmen.
However, you may be wondering what is the purpose of this module?
This module aims to equip you with basic data literacy skills, which are highly relevant in this century. This means that you will be able to analyse and make sense of data sets if you ever come across them in the future. You will also gain a basic understanding of using the R Commander statistical software while also learning new tricks with Microsoft Excel.
All these are illustrated through many real-life examples to give you an understanding of how these concepts and knowledge can be applied outside of the module.

For example, let’s look at this meme from SGAG. Does 4 in 10 Singaporeans mean that 40% of all Singaporeans? You would probably answer with a resounding “Yes”. Ah, but after you take this module, you might realise that this answer to this question might not actually be a “Yes”.
Why is that so you might ask? Well, you just have to survive this module to find out!
Is GEA1000 pre-allocated?
You will be pre-allocated the module as you are required to do it to fulfill the “Data Literacy” pillar of the new general curriculum. As such, you are not required to register for it during module registration.
GEA1000 is the default module for this pillar, as it is the most basic data literacy module. Thus, you do not require prior experience in advanced mathematics or statistics to do it, although it does help to make your life easier.

Even though GEA1000 is pre-allocated, you can choose to drop it and take a more advanced statistics module to fulfill this pillar.
These more advanced modules and their respective codes are:
| Module Code | Module Name |
|---|---|
| ST1131 | Introduction to Statistics and Statistical Computing |
| DSA1101 | Introduction to Data Science |
| BT1101 | Introduction to Business Analytics |
However, you can only change to these advanced options if you are given the option too!
As seen from the picture above:
- Some faculties/degrees do give the option to change – CHS, Computer science, etc.
- However, others do not give that option – Real Estate, Engineering
If you are eligible and interested in changing modules, here are the steps:

Grading Allocation (%)
Disclaimer: Your grading allocation might be different from mine as at this point of time when I’m writing this, GEA is still a new introduction into NUS’s GE curriculum. As such, changes are still being made within the module based on feedback from students, so it is entirely possible that the grading might change by the time you take it.
But based on my experience in AY21/22 Semester 1, the grading allocation was:
- 10% – Online Quizzes – 6 total
- 15% – Tutorial/Class Participation
- 15% – Midterm Test
- 30% – Final Examination
- 30% – Group project
Components
Disclaimer: Like grading – the syllabus is still subject to change over time.
You can expect to gain a basic understanding of statistics and learn how to analyse and interpret data sets. The lecture content is split up into 4 distinct chapters:
- Chapter 1: Introduction to data – How data is obtained, Different types of data and variables, Basic terms used in data analysis
- Chapter 2: Analysis of Categorical Variables – Rates, Concept of “Association” between variables, Confounders
- Chapter 3: Analysis of Numerical Variables – Boxplots and Histograms, Scatterplots, Correlation Coefficient
- Chapter 4: Probability – What “Probability” is, Rules of Probability, Using Probability to make inferences

Apart from these lecture contents, you will also learn through additional tutorial videos on how to use the R Commander software(above) and Microsoft Excel to manipulate data sets and make sense of them.
Even though these are not tested for the examinations, they are crucial for your group project – which comprises 30% of your total grade.
A brief dive into the chapters
Let me give you a brief idea of what you could expect to learn from each chapter so you can get a sense of what you’re about to get yourself into.
Chapter 1: Introduction to data
This chapter is the simplest out of all, but is also the most important. Its importance comes from it setting the foundation which you will build upon as this module progresses.
The chapter begins by explaining simple terms used in statistics such as sample, population, and sampling frame.

From there, it progresses into different methods of obtaining data and their respective strengths and limitations. Finally, it ends up with an introduction to the term “Variables” which you will see a lot more of in the following chapters.
Chapter 2: Analysis of Categorical Variables

This chapter picks up from Chapter 1’s introduction of “Variables” and focuses solely on one type – Categorical Variables. From this, the concept of “Rates” will be introduced to understand the idea of “Association”.
This chapter is slightly tougher than Chapter 1 and you may realise that this is a consistent trend with each chapter increasing in difficulty.
Chapter 3: Analysis of Numerical Variables

Since the stars of Chapter 2 were the Categorical Variables, Chapter 3 takes a look at its counterpart – the Numerical Variables. This chapter introduces the different types of graphs that you may use to visualise data such as boxplots, histograms, and scatter plots.
From this, the concept of “Correlation Coefficient” will be introduced and this is a pretty important one so mark that out.
Chapter 4: Probability
And finally is the toughest chapter of all – Probability. I struggled the most with this chapter as it introduced the most number of and most complex concepts.

Ideas such as independence and mutual exclusivity will be introduced and if they sound familiar, it might be because of the Venn Diagram you learned in Secondary School. You will also then be given a refresher on different hypothesis tests – such as the Chi-squared test or 1-sample T-test.
I would say to expect to spend a greater amount of your time on this chapter as compared to the others. This is due to it being the most challenging and content-heavy out of the 4 chapters.
Quizzes
4 out of 6 of your online quizzes will be based on each of the individual chapters. These quizzes tend to be released the week after your lecture for that chapter has been released.
“For example, if all the lecture videos for Chapter 1 are released in Week 2, your quiz will be in Week 3.”
For your 2 remaining quizzes, they will be released in the weeks leading up to your Final Examinations. These 2 quizzes will test you questions from all the chapters covered in the module, serving as a form of revision for you.

My final 2 quizzes were held in the 11th week and 13th week, before our finals in the 14th week.
Midterms/Final Examination
Note: Your papers will likely be done online through Examplify and invigilated via Zoom due to COVID.
Your Midterms and Finals make up a significant portion of your overall grade, constituting about 45% of it. As such, you do want to try and do your best for them, and scoring well is not as difficult as it may seem!
As I mentioned above, despite learning how to make use of R Commander and Microsoft Excel, ironically, the examinations do not actually require you to make use of them.
Instead, these examinations will be based solely on the content within your lectures. The content covered in your Midterms would comprise of the first 2 chapters while the Final Examination covers content from all chapters.
While there are questions in both papers which focus on calculation, your ability to understand the concepts taught is of the utmost importance.

Numerous questions within them are solely concept-based without a need for calculation (seen above), while there are also some which blend both concepts and calculations. (seen below)

Thus, while learning how to apply the correct formulae is important, the key to scoring well from my experience is by mastering the concepts taught – such as the rule of rates or the limitations of different experimental designs, etc.
As such, as long as you have a good understanding of the concepts introduced, scoring well for these papers is not difficult! YouTube is definitely helpful if you come across any concepts that trouble you.
I would search up the concepts I had trouble with such as binomial distributions and would skim through videos till I found the one that I could understand best. Thus while many videos are explaining a single idea, certain videos may fit your understanding better.
Group project
It is vital that you are able to use R Commander and Excel for this segment! For your group project, your respective tutors will assign you to your individual groups.
This project is split into 2 parts – Part A and Part B. The tasks for these 2 parts are released at different times and have different requirements.
This was the timeline that was provided to us when I was doing this module. As you can see, Part A was released in Week 6 while Part B was only released in Week 7.

Part A requires you to evaluate a study from a list provided by your tutors – based on the ideas taught in the first 2 chapters.
Part B would be the tougher portion and requires you to analyse a data set provided – using the concepts taught in all the chapters – as the project is due only after all chapters have been taught.

Your answers for both parts are then compiled together into a report and a set of presentation slides to be submitted concurrently. Following that, before your finals, you will do a presentation with your group based on your submitted slides.
When I was taking the module, the deadline for my submissions was on the 29th of October. However, my presentation only took place on the 12th of November!

After the presentation, your tutor will also have a Q&A segment where you will be graded individually based on your ability to answer their questions. As such, it is important for you to understand what you’re doing during the entirety of the project!

I had a pretty bad experience myself with one of my group mates who contributed absolutely nothing to the report or the slides. It was a hassle to try and explain the entire project to her before the presentation. So…please don’t be that guy.
Workload
Like most other modules, there are both tutorials and lectures.
Lectures
Due to COVID, you won’t be having any live lectures but instead, pre-recorded lectures will be accessible from Sunday 2359 every week for your viewing on LumiNUS. Usually, we had around 8-10 videos per week with each lasting around 5-10 minutes.
“As such, you could expect to spend around 1-1.5 hours per week watching the lectures.”
My recommendation would be to take your own notes while watching these lecture videos to save yourself time from studying them at other times. As these are also all pre-recorded, you can easily rewind them if you need to re-watch any portions to understand them better!
Apart from these lecture videos, many additional 10 min tutorial videos will teach you the different functions of the R-commander software and tips for using Microsoft Excel – such as formulas to use to make your calculation simpler and faster.
These videos are optional in a sense, as I myself didn’t really watch all of them. I relied more on Google as I found it quicker to do an online search as opposed to watching a 10-minute video. However, they are definitely helpful and come in handy when it is easier for you to understand a function by watching someone do it as opposed to reading instructions.
Tutorials
Your tutorial assignments are released each week after each chapter is completed. The difficulty of the questions tends to scale from the first to the final.

This is to give you a chance to familiarise yourself with the concepts first – by doing simpler questions – before challenging you to apply them on the tougher questions.
These on average took me around 2 hours to complete each week. They do also sometimes require you to use Excel or R Commander, serving as good practice for your group project!

Despite having pre-recorded lectures, your tutorial meetings are still face-to-face! These sessions last around 2.5 hours and happen bi-weekly. In total, you will have only 5 tutorial sessions since they only happen once every 2 weeks.
During your tutorial sessions, your tutor will go through with you the answers for the tutorial assignment while also going through the content of the lecture for that week.
Thus, it would be a good idea to bring all your burning questions with you to class to clarify them before you melt under their pressure!
Using my tutor as an example, he usually spent the first hour of each session, going through the answers for the tutorial assignment while teaching us how to use R Commander. After that, he would spend another hour summarising all the concepts covered in the previous week’s lecture. At the same time, also giving us pointers on their common misconceptions. Finally, he would end off with a Q&A session, where he would take any questions we had.
However, as different tutors do have different styles of teaching, your experience may not be completely the same as mine!
Bell Curve
I would say that it is definitely not extremely difficult to score well in this module as the 6 online quizzes and 2 papers are actually all “open book”. This means that you can easily achieve the full 70% of your final grade – 10% from quizzes, 15% from tutorial participation, 45% from the 2 examinations – if you are well-versed with all the concepts and ideas taught.
However, due to this, the course is highly competitive with everyone trying to achieve this full 70%.
As such, the defining factor will be your group project, so I would suggest focusing on it and producing a good one!
As the module tutors chose not to mention anything about how the bell curve for this module worked, I myself am not too clear on it. However, based on this blog post which is still relevant to this day, it would be safe to assume that only around 25% of the students would score an A, A- or A+.
The only smidgen of information the tutors were willing to tell us was that they would be slightly more lenient with the grading due to COVID so more A’s might be given out – but take this with a pinch of salt!
Is GEA1000 tough?
While GEA1000 might be the most basic data literacy module available, it is still tough if you do not have any prior experience with statistics or the concepts taught.
Thus, if you’re coming from JC, you might have a slight advantage over others as your math in JC would have probably covered the topics taught in this module.
Can you S/U the subject?
The question on your mind now is probably – “Wah if it’s tough, can I S/U the subject?”

The good news is that you can S/U the subject as seen here. However, the bad news is that you have to score between a C or A to be given the passing grade.
If you score a U grade, you will be pre-allocated the module again in your next semester. Thus even though you can S/U the subject, you do still have to put effort into scoring at least a C to meet the required grade for passing the module.
*Update to S/U as of 13 December 2021*

With the recent changes to S/U option (as of 13 December 2021) – the ‘D’ or ‘D+’ grade has been conferred the ‘S’ grade. As such, the minimum grade that you need to score to pass GEA is now ‘D’.
What is the Relevance of GEA1000?
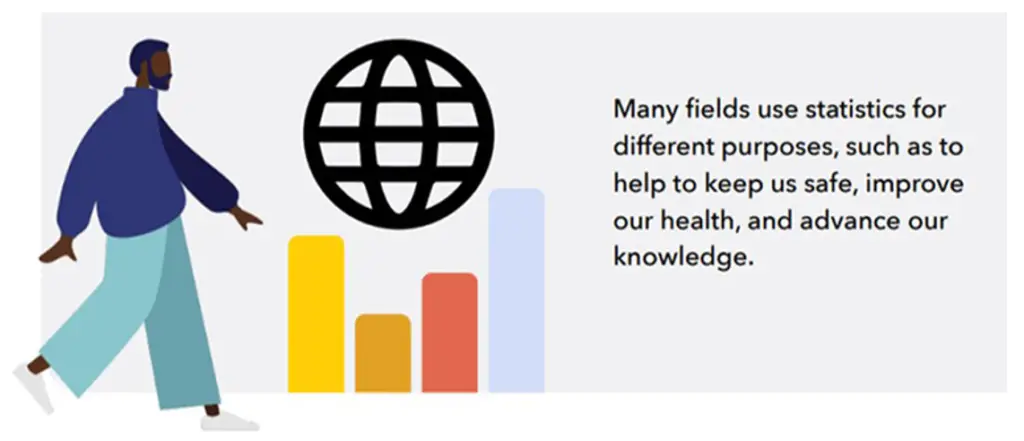
I definitely do feel that statistics is very relevant to our current time and does have a lot of real-life applications, such as illustrated in this blog post. From quality testing to scientific research, statistics do play a role in all of them. Thus, you should try your best to learn and take away the knowledge taught in this module as you never know when you might need them!
Furthermore, it is not only theoretical knowledge that you will be gaining. This module has definitely made me a more proficient user of Microsoft Excel. I’ve learnt many new useful functions that I’ve never even heard of before such as the Data Analysis Toolpak.
“As such, there are many technical skills that you will be taking away from this module that can help you in the future.”
What’s the difference between GEA1000 and GER1000?
GEA1000 is actually the successor module of GER1000 as seen stated here. There is a stark contrast between the 2 as GEA1000 is comparatively easier as compared to GER1000. This is due to GER1000 introducing more concepts such as Odds Ratio which are not touched upon or mentioned in GEA1000.
As such, if you do get a hold of past year examination papers from your seniors, there might be many questions that you will be unfamiliar with as they would have done GER1000 instead.
But fret not! As those questions that you’ve never seen before, aren’t even in your syllabus so feel free to ignore them.
Verdict
Summing it up, GEA1000 is a useful addition to your university education in my point of view. It is highly relevant in our current society and the skills learnt are certainly transferable into your own field.
While it is definitely tough if this is your first time learning statistics, many online sources can help to clarify your issues if you take your time to look!
It might take time to understand the concepts learnt, but once you understand them, there is really no need for you to take the additional time to study them. When compared to other modules, I would say that studying for this module is easier in a way as the only tough part is understanding the concepts.
With that, I wish you the best of luck taking this module! Oh and do ask around for the GEA1000 telegram group chat link.

If you enjoyed this content, do follow us on Telegram!

Want to earn some money while sharing your experiences in Singapore? We’re always looking for writers and you can join our team here!